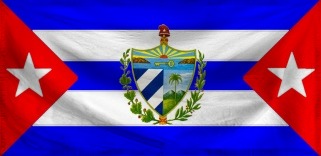
The Republic of NS Greater Miami Shores
Make Miami Great Again Adelante Forward
Region: Osiris
Quicksearch Query: NS Greater Miami Shores
|
Quicksearch: | |
NS Economy Mobile Home |
Regions Search |
NS Greater Miami Shores NS Page |
|
| GDP Leaders | Export Leaders | Interesting Places BIG Populations | Most Worked | | Militaristic States | Police States | |

Make Miami Great Again Adelante Forward
Region: Osiris
Quicksearch Query: NS Greater Miami Shores
| NS Greater Miami Shores Domestic Statistics | |||
|---|---|---|---|
| Government Category: | Republic | ||
| Government Priority: | Defence | ||
| Economic Rating: | Strong | ||
| Civil Rights Rating: | Some | ||
| Political Freedoms: | Few | ||
| Income Tax Rate: | 8% | ||
| Consumer Confidence Rate: | 99% | ||
| Worker Enthusiasm Rate: | 99% | ||
| Major Industry: | Arms Manufacturing | ||
| National Animal: | El Sinsonte | ||
| NS Greater Miami Shores Demographics | |||
| Total Population: | 12,656,000,000 | ||
| Criminals: | 1,492,194,358 | ||
| Elderly, Disabled, & Retirees: | 1,739,331,224 | ||
| Military & Reserves: ? | 768,734,829 | ||
| Students and Youth: | 2,075,584,000 | ||
| Unemployed but Able: | 2,010,454,107 | ||
| Working Class: | 4,569,701,481 | ||
| NS Greater Miami Shores Government Budget Details | |||
| Government Budget: | $23,260,964,955,409.61 | ||
| Government Expenditures: | $21,400,087,758,976.84 | ||
| Goverment Waste: | $1,860,877,196,432.77 | ||
| Goverment Efficiency: | 92% | ||
| NS Greater Miami Shores Government Spending Breakdown: | |||
| Administration: | $2,140,008,775,897.68 | 10% | |
| Social Welfare: | $0.00 | 0% | |
| Healthcare: | $2,140,008,775,897.68 | 10% | |
| Education: | $2,140,008,775,897.68 | 10% | |
| Religion & Spirituality: | $0.00 | 0% | |
| Defense: | $5,136,021,062,154.44 | 24% | |
| Law & Order: | $4,494,018,429,385.14 | 21% | |
| Commerce: | $1,712,007,020,718.15 | 8% | |
| Public Transport: | $2,140,008,775,897.68 | 10% | |
| The Environment: | $2,140,008,775,897.68 | 10% | |
| Social Equality: | $0.00 | 0% | |
| NS Greater Miami ShoresWhite Market Economic Statistics ? | |||
| Gross Domestic Product: | $18,060,800,000,000.00 | ||
| GDP Per Capita: | $1,427.05 | ||
| Average Salary Per Employee: | $2,517.87 | ||
| Unemployment Rate: | 24.68% | ||
| Consumption: | $114,164,245,179,924.48 | ||
| Exports: | $15,762,978,242,560.00 | ||
| Imports: | $17,116,841,377,792.00 | ||
| Trade Net: | -1,353,863,135,232.00 | ||
| NS Greater Miami Shores Non Market Statistics ? Evasion, Black Market, Barter & Crime | |||
| Black & Grey Markets Combined: | $32,669,818,924,148.52 | ||
| Avg Annual Criminal's Income / Savings: ? | $2,146.45 | ||
| Recovered Product + Fines & Fees: | $5,145,496,480,553.39 | ||
| Black Market & Non Monetary Trade: | |||
| Guns & Weapons: | $1,882,663,655,141.91 | ||
| Drugs and Pharmaceuticals: | $1,176,664,784,463.69 | ||
| Extortion & Blackmail: | $1,411,997,741,356.43 | ||
| Counterfeit Goods: | $3,216,217,077,534.09 | ||
| Trafficking & Intl Sales: | $1,176,664,784,463.69 | ||
| Theft & Disappearance: | $784,443,189,642.46 | ||
| Counterfeit Currency & Instruments : | $3,373,105,715,462.58 | ||
| Illegal Mining, Logging, and Hunting : | $1,176,664,784,463.69 | ||
| Basic Necessitites : | $392,221,594,821.23 | ||
| School Loan Fraud : | $1,176,664,784,463.69 | ||
| Tax Evasion + Barter Trade : | $14,048,022,137,383.87 | ||
| NS Greater Miami Shores Total Market Statistics ? | |||
| National Currency: | Peso | ||
| Exchange Rates: | 1 Peso = $0.19 | ||
| $1 = 5.32 Pesos | |||
| Regional Exchange Rates | |||
| Gross Domestic Product: | $18,060,800,000,000.00 - 36% | ||
| Black & Grey Markets Combined: | $32,669,818,924,148.52 - 64% | ||
| Real Total Economy: | $50,730,618,924,148.52 | ||
| Osiris Economic Statistics & Links | |||
| Gross Regional Product: | $1,311,738,812,413,509,632 | ||
| Region Wide Imports: | $166,626,228,365,688,832 | ||
| Largest Regional GDP: | Patrua | ||
| Largest Regional Importer: | Itinerate Tree Dweller | ||
| Regional Search Functions: | All Osiris Nations. | ||
| Regional Nations by GDP | Regional Trading Leaders | |||
| Regional Exchange Rates | WA Members | |||
| Returns to standard Version: | FAQ | About | About | 483,259,651 uses since September 1, 2011. | |
Version 3.69 HTML4. V 0.7 is HTML1. |
Like our Calculator? Tell your friends for us... |